This guide walks through two practical challenges: benchmarking your current offerings against industry peers, and evaluating benefits packages from providers or PEOs when building or upgrading your HR strategy. Both require the same disciplined approach.
Here's what you'll find below: the key benefits categories every employer must evaluate, six factors that separate a real comparison from a surface-level one, and a step-by-step framework for running a side-by-side analysis.
Key Takeaways
- Benefits make up 30.1% of total employer compensation costs — understanding them is just as important as evaluating base salary
- Effective comparison requires evaluating employee cost exposure, coverage quality, and compliance — not just plan names or premium amounts
- Benchmark "competitive" against your specific industry, company size, and workforce demographics — not the market at large
- Assigning dollar values to each benefit in a side-by-side framework exposes the real gap between packages
- Small businesses can access enterprise-level benefits through PEO arrangements that pool employees for group pricing
What "Comparing Employee Benefits" Really Means for Employers
Comparing employee benefits isn't a matter of listing what you currently offer and checking it against a competitor's careers page. It means calculating the total compensation value your package delivers, assessing actual benefit quality (not just whether a plan exists), and measuring your offerings against what similar employers provide to similar workers.
The stakes are higher than most employers realize. According to the Bureau of Labor Statistics, private-industry benefits cost employers an average of $14.01 per hour worked as of March 2026 — that's 30.1% of total compensation, with wages accounting for the remaining 69.9%. That's not a rounding error — it's a line item that shapes whether candidates accept offers and whether employees stay.
This is the concept behind the "invisible paycheck" — the full monetary value of what an employer provides beyond base salary. When employees evaluate job offers or decide whether to stay, they're often weighing this full picture, whether or not they can put a number to it.
Two Distinct Comparison Scenarios
Employers typically face one of two situations:
- Internal benchmarking — How does your current benefits package compare to what industry peers offer to similar employee populations? This reveals competitive gaps you may not know exist.
- Provider or PEO comparison — When building or upgrading your benefits strategy, which vendor, insurer, or PEO partner delivers the most value for your budget?
Both scenarios require the same structured evaluation process, and both are addressed in the framework below.
Benefits Categories Every Employer Must Evaluate
Miss a category in your benefits comparison and you risk losing candidates — or current employees — to competitors who filled that gap. Each area below carries real dollar value and real competitive weight.
Health and Medical Benefits
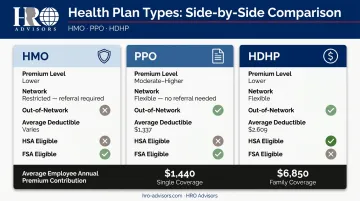
This is typically the highest-cost category for both employers and employees. The KFF 2025 Employer Health Benefits Survey reports average annual premiums of $9,325 for single coverage and $26,993 for family coverage, with employees contributing $1,440 and $6,850 respectively.
Comparison here must go beyond whether a plan exists. Evaluate:
- Premium cost-sharing ratios (who pays what percentage)
- Deductible levels by plan type (PPO averages $1,337; HDHP averages $2,609)
- Out-of-pocket maximums
- Network breadth and plan type (HMO, PPO, HDHP)
- HSA and FSA availability
Retirement and Financial Security Benefits
401(k) availability is expected in most industries now. The differentiator is what surrounds the plan. According to Vanguard's 2025 How America Saves report, the average employer match was 4.6% of pay, with a median of 4.0%. The most common formula: $0.50 per dollar on the first 6% of pay.
Vesting schedule matters too. 48% of plans offer immediate vesting on matching contributions — a significant attraction factor compared to plans with 5- or 6-year graded schedules.
Paid Time Off and Leave Policies
PTO has direct, calculable dollar value. BLS data shows 80% of private-industry workers had paid vacation access in 2025, with averages of 11 days after one year, 15 days after five years, and 20 days after 20 years.
When comparing packages, distinguish between:
- Vacation, sick leave, and personal days
- Paid parental leave (only 40% of employers offer this, per SHRM 2024 data)
- Structured vs. unlimited PTO policies
Flexibility and Work Arrangement Benefits
Remote and hybrid work carries measurable financial value — one that belongs in any total compensation comparison. Key data points to factor in:
- Employees value working from home 2-3 days per week at roughly 8% of pay (WFH Research)
- The average remote worker saves 65 minutes per day in commuting time
- 51% of remote-capable U.S. employees worked hybrid in 2025, per Gallup
Professional Development and Lifestyle Benefits
These are increasingly the differentiators for younger workforces. SHRM's 2025 survey rates professional development at 65% importance among benefit categories. Current prevalence benchmarks:
- Tuition assistance: 46% of employers
- Student loan assistance: ~9% of organizations
- Wellness programs: 39% of employers
For talent competing on budget rather than brand name, these benefits often tip the decision.
6 Key Factors to Evaluate When Comparing Employee Benefits Packages
Surface-level comparison — looking at plan names and premium amounts — produces misleading conclusions. These six factors give you a more complete picture.
Factor 1: True Cost to the Employee
Two plans with similar coverage levels can impose very different financial burdens on employees. The gap between a PPO ($1,337 average deductible) and an HDHP ($2,609 average deductible) represents more than $1,200 in additional annual exposure — before any other costs.
When comparing packages, calculate the employee cost exposure: monthly premium share plus estimated annual out-of-pocket costs. This metric matters most for lower-to-mid wage workers, where benefits represent a larger share of real compensation.
Factor 2: Coverage Quality and Network Adequacy
Plan tier and network type determine whether insurance is actually usable. A plan that looks competitive on premium might fail employees in practice if the network excludes local specialists or the deductible makes routine care unaffordable.
When evaluating PEO or insurer offerings, always ask specifically about network coverage in the geographic areas where your employees live and work — not national averages.
Factor 3: Legal Compliance and Mandatory Minimums
Before evaluating competitive advantages, confirm you're meeting legal minimums:
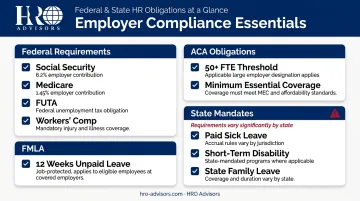
- Federal requirements: Social Security (6.2% each employer/employee), Medicare (1.45% each), FUTA, workers' compensation
- ACA obligations: Employers with 50+ full-time equivalents must offer ACA-compliant coverage
- FMLA: Up to 12 weeks unpaid, job-protected leave for eligible employees at covered employers
- State mandates: Paid sick leave, short-term disability, and state family leave laws vary significantly by state
Requirements shift significantly based on headcount, state, and industry — so confirm your regulatory baseline before drawing any competitive conclusions.
Factor 4: Workforce Demographics and Utilization Fit
The best benefits package is one your employees will actually use. Demographic profile shapes what "competitive" actually means for your workforce:
- Younger employees tend to prioritize student loan repayment assistance and parental leave
- Mid-career workers often weigh childcare benefits and flexible spending accounts heavily
- Older workforces typically value retirement matching and long-term disability coverage most
Enrollment and utilization data will confirm whether those assumptions hold. Low utilization usually signals either poor communication or a genuine mismatch — both of which are fixable once identified. That data also gives you a sharper starting point for industry benchmarking.
Factor 5: Benchmarking Against Industry Peers
Benefits expectations differ significantly by sector. BLS data shows goods-producing industries allocate 32.3% of compensation to benefits, while service-providing industries average 29.6%. Management and professional occupations run 31.5%; service occupations, 23.2%.
Size matters equally: KFF data shows 97% of firms with 200+ workers offer health benefits, versus 59% of firms with 10–199 workers. Without an industry-specific and size-appropriate benchmark, you're measuring yourself against the wrong standard — which leads to real decisions based on the wrong data.
Factor 6: Administrative Burden and Scalability
A benefits package that requires significant HR time to administer carries indirect costs that don't appear on any invoice. For companies under 100 employees — where HR responsibilities often fall on one or two people, or directly on the owner — this burden can be substantial.
PEO-administered benefits shift enrollment, compliance tracking, and carrier communications off internal teams — while unlocking group rates that small employers can't access on their own. NAPEO data shows PEO client businesses grow twice as fast and have 12% lower turnover than comparable non-PEO businesses.
How to Run a Side-by-Side Employee Benefits Comparison
Follow these five steps to move from intuition to a structured, data-backed comparison.
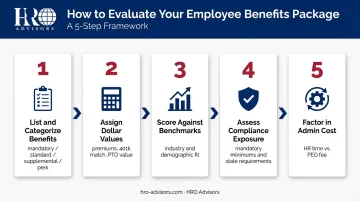
List every benefit component and categorize it — Sort each item as mandatory, industry-standard, supplemental, or perk. This immediately surfaces coverage gaps and creates an apples-to-apples structure.
Assign an annual dollar value to each benefit — Calculate the employer's premium contribution, the estimated 401(k) match at a typical contribution rate, PTO value (annual salary ÷ 52 weeks × PTO weeks), and any stipend or allowance amounts. The output is a "total compensation equivalent" for each package.
Score each package against your workforce demographics and industry benchmarks — Rate coverage quality, leave policies, and supplemental offerings against both your specific workforce profile and what comparable employers in your sector provide.
Assess compliance exposure — Confirm mandatory benefits are met, verify state-specific requirements, and flag any areas that create penalty or litigation risk.
Factor in total administrative cost — Estimate the internal HR time required for open enrollment, carrier communications, and compliance reporting. If evaluating a PEO option, calculate what the PEO management fee costs versus the HR labor and benefits administration overhead it replaces. HRO Advisors provides free side-by-side PEO comparisons across up to 8 providers to make this cost-benefit analysis straightforward.
How HRO Advisors Helps Businesses Compare and Access Better Benefits
For most small and mid-sized businesses, the challenge isn't just comparing benefits — it's knowing how to access competitive options in the first place. HRO Advisors works as a PEO broker, matching employers with the right PEO partner from a network of 500+ providers to unlock group health plans and benefits tiers that smaller organizations typically can't negotiate independently.
Getting there follows a clear process:
- Collect detailed workforce data — current HR costs, benefits needs, and compliance requirements
- Run a side-by-side analysis of up to 8 PEOs matched to the employer's industry, size, and workforce profile
- Negotiate directly with providers to secure the best available rates and terms — free to the employer
Key differentiators:
- Access to enterprise-level health plans unavailable on the open market, made possible through PEO co-employment pooling
- Industry-specific PEO matching expertise across 14+ sectors, including tech, financial services, manufacturing, healthcare, and senior living
- Potential to save up to 40% on HR costs while improving benefits quality
- Free, no-obligation consultation covering intake, implementation, and ongoing support
Frequently Asked Questions
What are the top 5 employee benefits?
According to SHRM's 2025 survey, the highest-priority categories are health care (88%), leave (81%), retirement savings (81%), flexible work (68%), and family care (67%). Priority shifts by demographics — younger workers tend to rank flexibility and student loan support higher, while older employees weight retirement and disability coverage more heavily.
How do you compare benefits packages?
List all benefit components, assign each an annual dollar value to the employee, benchmark the full package against industry peers, and calculate the employee's total cost exposure — not just the headline premium. The goal is a total compensation equivalent for each package, not a checklist of features.
What is the difference between mandatory and optional employee benefits?
Mandatory benefits include Social Security and Medicare contributions, workers' compensation, unemployment insurance, and ACA-compliant health coverage for employers with 50+ full-time equivalents. Optional benefits — dental, vision, retirement matching, wellness programs — are employer-discretionary but often essential for competitiveness in most labor markets.
How do employee benefits vary by company size?
Larger companies offer more comprehensive packages because they have greater purchasing power and access to group rates. Smaller companies can close this gap through PEO arrangements, which pool employees from multiple businesses to qualify for the same group pricing and plan quality that large employers negotiate independently.
What should employers benchmark when comparing benefits against competitors?
Focus on health plan cost-sharing ratios, 401(k) match rates and vesting schedules, PTO days by tenure, paid parental leave availability, and flexibility policies. SHRM's annual benefits survey and the BLS Employer Costs for Employee Compensation reports are the most reliable baselines for your sector and company size.
How can a PEO help a small business offer better employee benefits?
A PEO co-employs a small company's workers, pooling them into a larger group to qualify for group health plans and benefits tiers that the small business couldn't access alone. This typically reduces per-employee benefits costs while improving coverage quality, bringing small-employer packages much closer to what large employers offer.